|
|
|

|
Practical experimental design techniques for automatic and manual protein crystallization Patrick D. Shaw Stewart and Peter F.M. BaldockDouglas Instruments Ltd., Douglas House, East Garston, Hungerford, Berks. RG17 7HD, U.K. Corresponding author: Patrick Shaw Stewart Telephone: +44 (0)171 738 8226 Facsimile: +44 (0)171 738 8227 E-mail: patrick at douglas.co.uk Published in the Journal of Crystal Growth 196 (1999) 665 - 673 Abstract: When crystallizers are searching for the optimum crystallization conditions, they often carry out experiments that are confusing and difficult to interpret. This confusion arises because there are several important variables in any protein crystallization experiment (including protein concentration, precipitant concentration, pH and temperature) and these variables often interact - that is to say, changes in the level of one variable often change the optimum settings of the others. Confusion can be avoided by using appropriate experimental designs where all of the important variables are varied in each experimental run. Some well known and practical designs for automatic and manual crystallization are presented, and a simple practical example is given.Keywords: protein crystallization, crystallization of biological macromolecules,
experimental design, multivariate experimental designs, multidimensional experimental
designs, novel experimental designs, software for experimental design, automation,
automatic, IMPAX, microbatch, vapor diffusion, central composite design, Box-Behnken
design. This paper describes some pitfalls of conventional approaches, some of the well-established multivariate experimental designs, and useful software, including software written for IMPAX, an automatic crystallization system that specializes in the microbatch crystallization technique [1,2]. The microbatch method is particularly appropriate for multivariate designs since the crystallization conditions are known exactly. However, the same software that is used by IMPAX can be used for manual crystallization including vapor diffusion, and it is available at http://www.douglas.co.uk/software.htm. This program uses a novel method of generating designs where the user selects groups of geometric points (e.g. vertices, centers of edges, centers of faces, etc.) until the required number of experimental points are defined. This paper deals only with crystal optimization. Other designs that can deal with dozens of variables, such as the sparse matrix [3,4] and incomplete factorial [5] designs, should be used for screening to find initial crystallization conditions. Several simple multivariate designs are widely used in other fields (e.g. agriculture, food production, mechanical engineering). These include the central composite [6] and the Box-Behnken [7] designs described below. A few crystallizers have used multivariate designs. Carter et al. have used them extensively with several new proteins in order to determine their structures. For example, they used a full-factorial design (where all combinations of high and low settings of variables are used) to crystallize Bacillus stearothermophilus tryptophanyl-tRNA synthetase and to draw biochemical conclusions [8]. In the same paper they present a novel multivariate design for four variables that was created specially for protein crystallization called the Hardin-Sloane design. This was later used to crystallize E. coli cytidine deaminase [9]. More recently, Prater et al. used simplex designs to optimize conditions for several model proteins [10]. However, there seems to be a division between crystallizers who are interested in experimental design for its own sake, and those who simply want to get crystals as quickly and easily as possible for determining protein structures. The vast majority of crystallizers initially set up a two dimensional array of points where they vary precipitant concentration against pH. Only if this gives poor results do they try changing other variables. This paper seeks to explain the need for multivariate designs and make them accessible to crystallizers who are not interested in the theory of experimental design. 2. Using multivariate designs for crystal optimization Protein crystallization always involves at least four variables. These are:
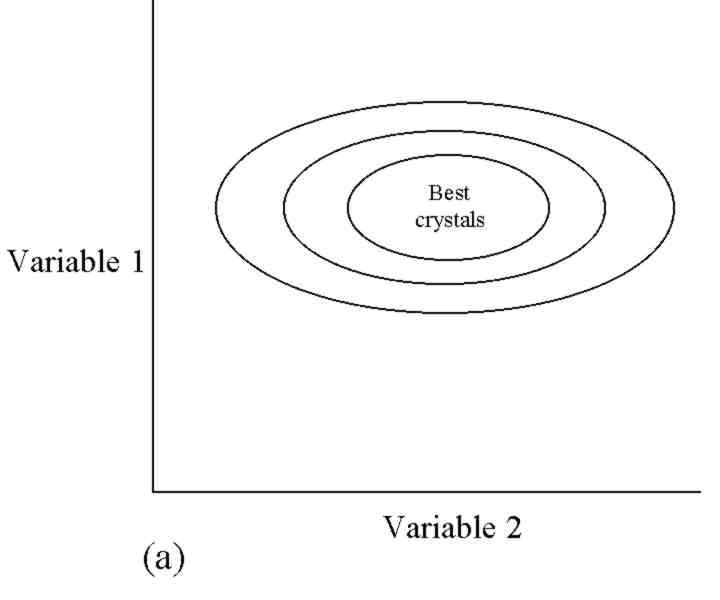
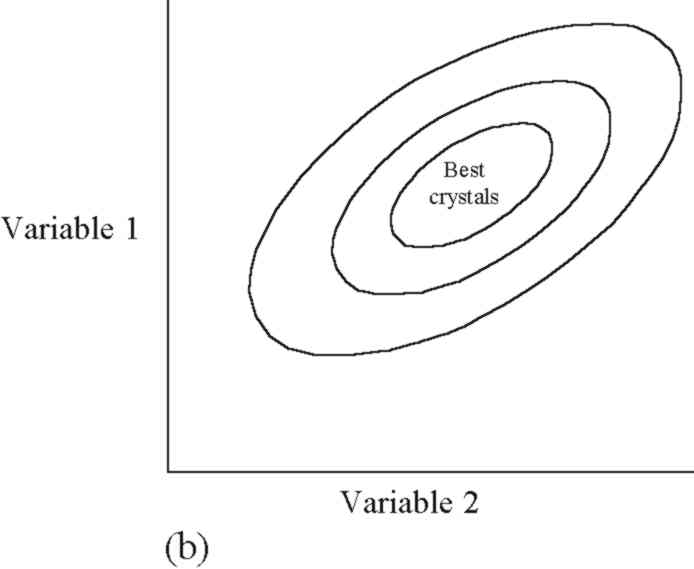
In addition, there may be one or more buffers and additives. Also, the history of the protein sample may affect crystallization and can be treated as a variable. Most crystallizers who wish to improve crystal quality concentrate on optimizing only two variables - precipitant concentration and pH (e.g.. [11]). This is generally done as a two-dimensional array of wells where precipitant concentration varies in one direction, and pH in another. This comparatively simple design reduces mistakes in manual pipetting and is adequate for proteins in good supply that crystallize easily. However, if optimization proves difficult much time and effort can be saved by using multivariate designs even when dispensing by hand. When using automatic dispensers, multivariate designs should be used routinely. In a multivariate experiment, all of the important variables are changed during each run of crystallization trials. The need for this arises because the variables often interact with each other. For example, if crystallization conditions are painstakingly optimized at one protein concentration, this work may have to be repeated if it is subsequently found that a different concentration works better. In a multivariate approach, variation of protein concentration would have been included in the first round of experiments. This would have shown the best direction to move within the multidimensional space defined by the major variables. Fig. 1a shows a contour plot of quality against two variables that do not interact with each other. The contours form circles or ellipses. As an example, variable 1 might be precipitant concentration, variable 2 might be protein concentration, and the contours might represent crystal quality. Fig. 1b shows two variables that do interact. Here the contours form ellipses whose axes are sloping.
Fig. 1a. A contour plot of the response of a system where two variables do not interact. Contours here show the quality of crystals. Fig. 1b. is a representation of a response where two variables do interact: here the best setting of variable 1 is affected by the setting of variable 2, and vice versa. There are several important problems with the conventional approach of changing only one or two variables in a run:
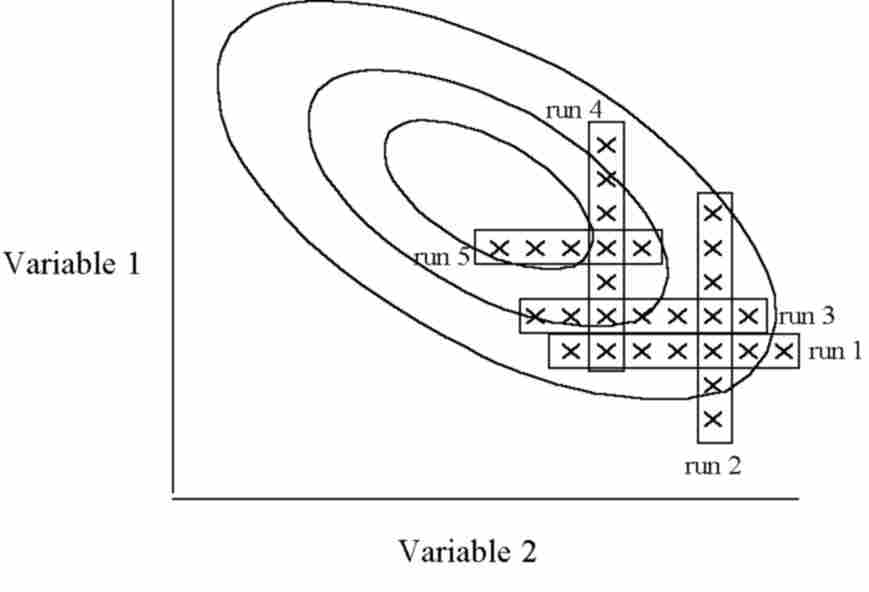
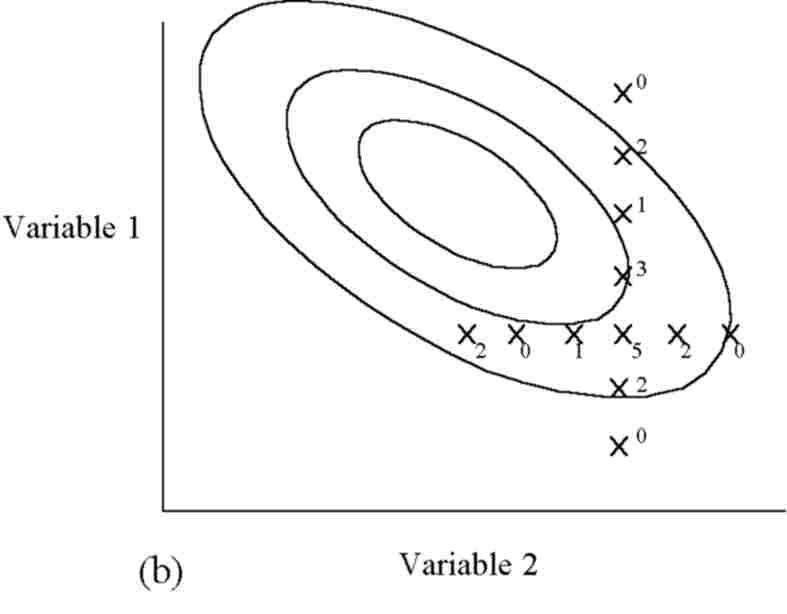
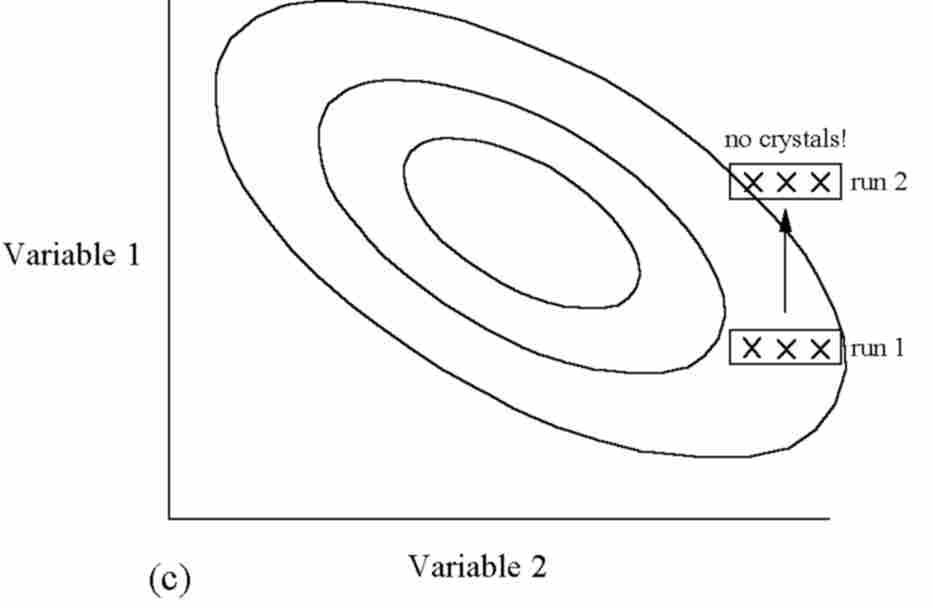
Figs. 2a-c. Three of the problems associated with conventional experimental designs where variables are changed singly or in pairs. In Fig. 2a, each row of points represents an experimental run. Since two variables need to be changed simultaneously, it takes many runs to get close to the optimum. Fig. 2b shows a case where experimental error has masked trends, suggesting that the optimum has been found when it has not. Higher numbers represent better quality crystals. Here the point marked 5 is erroneously identified as the optimum. Fig. 2c: a third reason for using multivariate designs is that variables must often be changed in large steps. For example, incubators are often available at only a few, widely spaced temperatures. In the example shown, the higher temperature (variable 1) gives no crystals, although it would give superior results if precipitant concentration (variable 2) were to be varied as well.
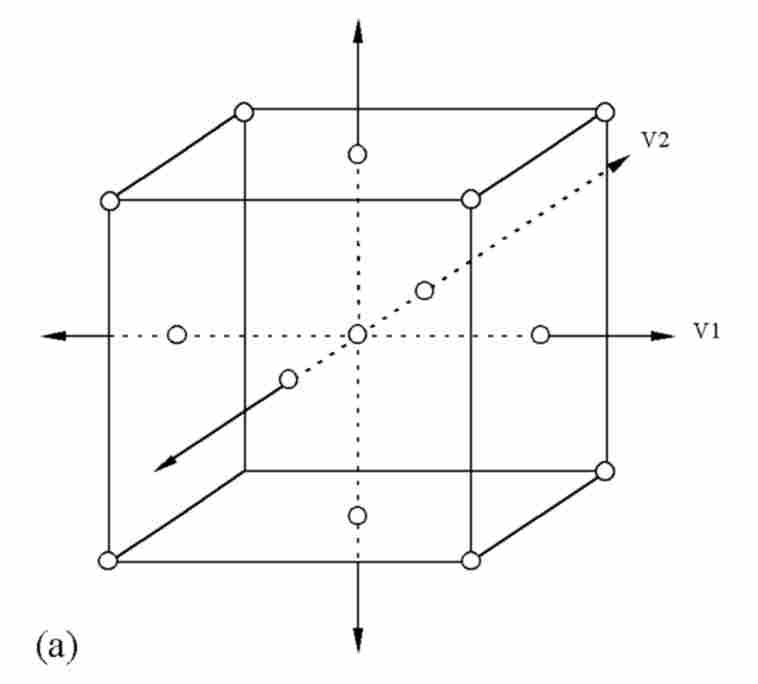
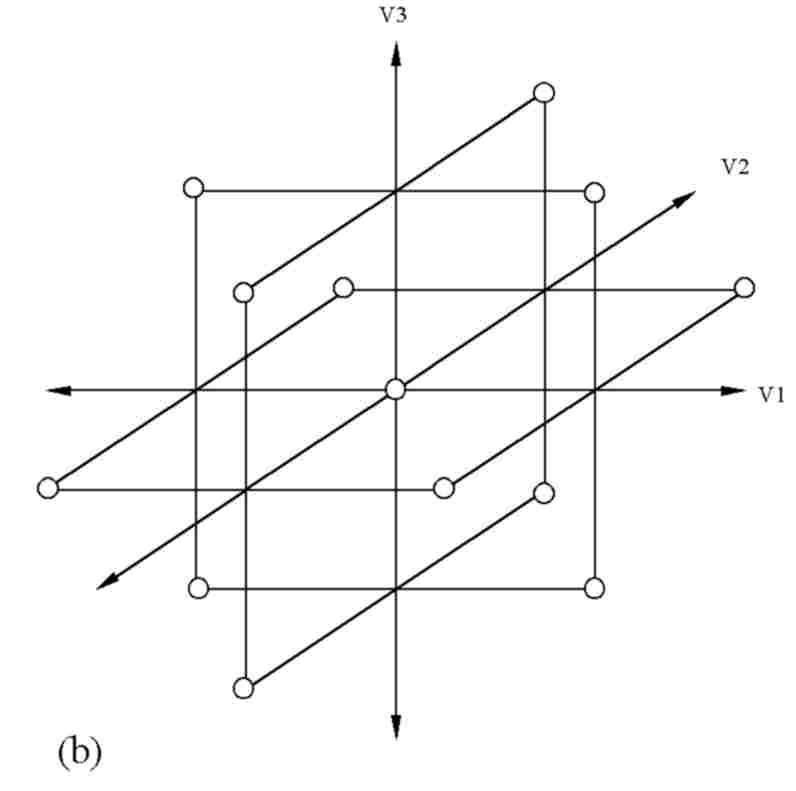
Well known multivariate designs Efficient experimental designs are often based on multidimensional cubes or spheres. In one of the most effective designs, known as the central composite [6], some trials are placed around a central point at the vertices of a multidimensional cube (all variables are varied) while other points are displaced from the central point parallel to the axes (one variable is varied while the others are set at their mid-levels). Fig. 3a shows a three-dimensional version (four- or five-dimensional experiments, which would be appropriate for protein crystallization, are difficult to illustrate graphically). Another well known design is the Box-Behnken [7]. Here two variables vary at each point. Fig.3b shows a three-dimensional version. At least one center point should be included in these designs. If mathematical analysis of the response (e.g. quality of crystals) is to be performed, it is useful to include several center points because any error in the value of the center point makes the interpretation of trends very difficult.
Fig. 3a. A very well known experimental design - the central composite. A three-dimensional version is shown, but higher numbers of dimensions can be used. This design consists of one or more center points (where all variables are set to their mid levels), together with "axial" points (where all variables are set to their mid levels except for one that is set to its high or low level) and "factorial" points (where all variables are set either to their low or their high levels). Usually several center points are dispensed to give an estimate of experimental error. Fig. 3b shows another well known experimental design - the Box-Behnken. Here, variables are changed two at a time, with all the other variables remaining at their mid levels. 4. Software, including a novel user-friendly method of designing experiments. The central composite, Box-Behnken and many other similar designs including novel designs can be generated and dispensed by the program XSTEP [1] used with IMPAX, an automatic dispensing system for microbatch crystallization. Designs with up to four variables, plus temperature, can be produced. Print-outs from the program can also be used as designs for manual experiments. Without recourse to detailed mathematical analysis, good results can be obtained simply by choosing the best point in an experimental run, and making this the center of the next run. If the best position for crystallization is clearly between two points in a run its position can be estimated "by eye". This approach is generally far quicker than using mathematical models such as response surface modeling to predict the best position for crystallization. One problem with mathematical analysis is that it is necessary to input the results of all trials into a program, which is time-consuming. Another is that it is not easy to transfer the experimental details from a control program for automatic crystallization to a program for mathematical analysis. However, for cases where protein is in very short supply and the supply of labor is plentiful, several commercial programs are available for such analysis. A good and user-friendly example is The Unscrambler by CAMO ASA, Trondheim, Norway. The use of XSTEP to generate multivariate designs will now be described briefly. The first step is to select well that gave good crystals in a previous experiment. Next, the AUTODESIGN function is called. A dialogue box appears as shown in Fig. 4. The center point (corresponding to the well with good crystals) is shown at the top left of the Experiment Design window. For a five-dimensional experiment, two or three levels can be selected for each variable as shown. Three levels are usually used (each variable has a high, a low and a medium level). Next, the range of variation is set for each variable. This may be as great as 100% for an additive that is of dubious value, or as little as 3% when one is near the end of optimization of a major variable. Here, judgment based on previous experience must be used.
Next the lower part of the dialogue box is used. An array of wells on a plate is shown on the right. The numerals show the number of variables that depart from their central value for each well. For example, the center points themselves are indicated by "0". The points where all five variables are changed are indicated by the numeral "5". These so-called "factorial" points correspond to the vertices of a five-dimensional cube. Similarly, "4"s indicate the centers of the edges, etc. By selecting the appropriate check boxes sets of points can be introduced or removed from the design. The central composite and Box-Behnken designs can be used either by pressing the corresponding buttons. Other designs can be invented as required. The particular design selected is not of paramount importance. Rather, the user should simply adjust the design until the desired number of experimental points is achieved. Using this approach, the points will always be placed symmetrically around the center point, and spaced reasonably far apart from each other. Finally, the experiment can be printed and carried out manually, or carried out automatically using the same program if an IMPAX system is available. Automatic execution takes a few minutes using the microbatch crystallization method, or a few tens of minutes using vapor diffusion crystallization.
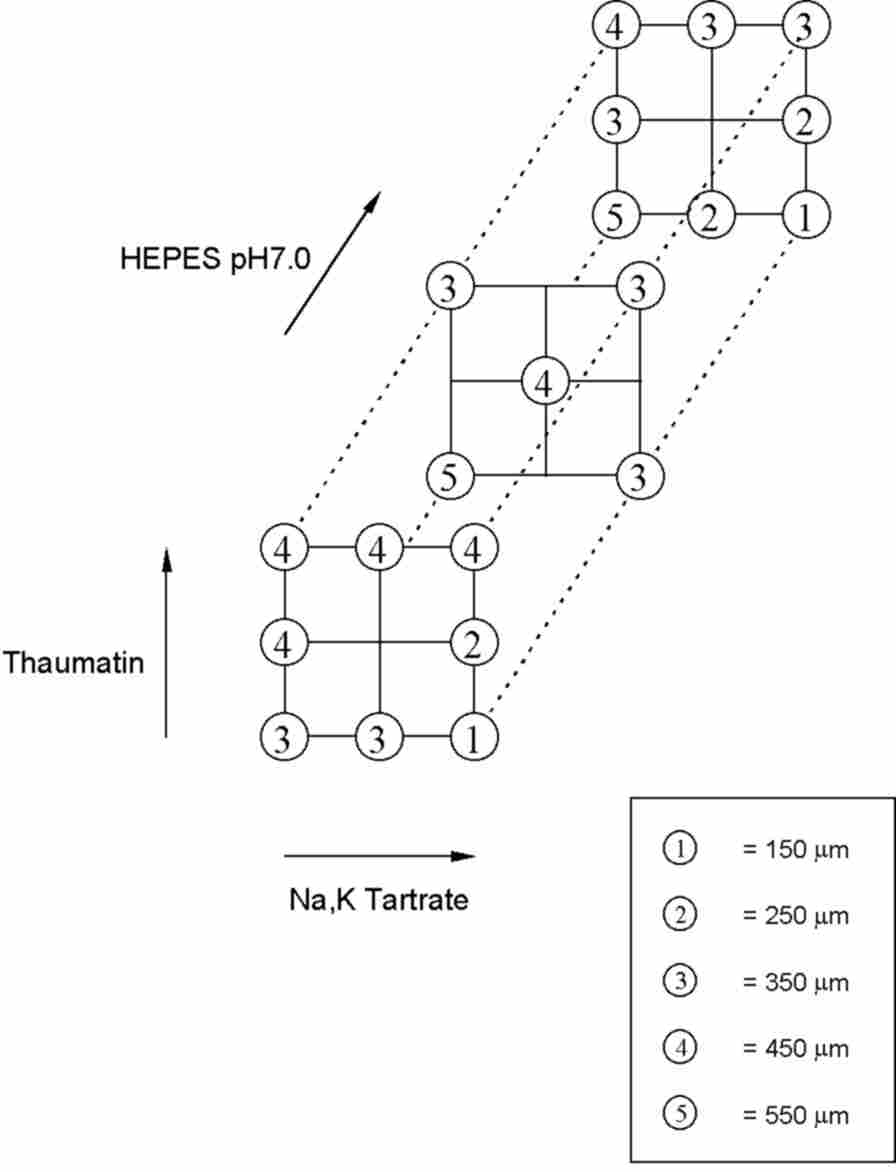
Temperature is an important and useful variable in protein crystallization because it provides an immediate method of changing the degree of supersaturation without disturbing the experiment. Most (though not all) proteins are more soluble at higher temperatures. This effect has been used to control the number of crystal nuclei formed in microbatch experiments by changing the temperature [12]. Temperature can easily be included in experiments by setting up several identical multivariate experiments and incubating each at a different temperature. This method is very convenient, but it is not optimal because the points are not evenly spread out. Since protein crystallization experiments are often very noisy, however, it can be helpful to have these extra points. A more correct method which requires more effort is to make temperature one of the variables of a single design. Thus a single Box-Behnken or central composite design would be dispensed onto three different plates which would be incubated at high, low and medium temperatures. This can be achieved by defining a regular design in triplicate, then deleting the wells that are not required. 6. A practical example Finally, we will consider a simple example where a multivariate design gave better results than a conventional design would have done. We wanted to improve the quality of crystals of the protein thaumatin (obtained from Sigma) grown in microbatch. We had found that approximately ten times the normal concentration of protein gave much larger crystals, but we wanted to see if we could improve them further. We chose to include two parameters that are not normally changed in the first round of optimization - protein concentration and buffer concentration (we wanted to see if the buffer was really needed). Since it is very hard to show graphically an experiment with four or more dimensions, we limited ourselves to three variables to illustrate the approach. We used a Box-Behnken design where two parameters are set to extreme values for each trial, but supplemented this with the factorial points where all three parameters vary. We chose this layout for no other reason than that we had about 20 microliters of protein and this design fitted conveniently into the top four rows of a crystallization plate. The experimental details and results are given in table 1. (On this table H indicates that a parameter is set to a high level, M to its mid level, and L to a low level.) Figure 5 shows the layout of the experiment as well as the results. Higher numbers indicate larger crystals.
Table 1 An example of optimization using multivariate experimental design
Note that the best crystals were found by varying protein concentration. They would not have been found in a conventional design where only pH and precipitant concentration would be varied. Note also the high level of noise in the results. Clearly it is not worth putting a lot of time and energy into analyzing these results. Of course the experiments could be repeated and the results averaged to decrease the amount of noise, but this would not help most crystallizers to achieve their objective - to obtain good quality crystals as quickly and with as little material as possible. In this case it would be far better to follow up with a design with a slightly smaller range centered around a point between wells 3 and 16.
Fig. 6. An example of the use of multivariate designs to optimize crystals. For
simplicity a three dimensional experiment was set up, although normally four dimensions
plus temperature would be used. The design consisted of 2 center points, 12 Box-Behnken
points (centers of edges) and 4 full-factorial points (vertices). Higher numbers indicate
larger crystals. See text and table 1 for details. Note that the best crystals were formed
by reducing protein concentration - [thaumatin] - a parameter that would not normally be
changed. 7. Conclusions Software is available to design multivariate experiments for protein crystallization automatically or manually. Such designs reduce the number of experimental points, saving time and materials, and help to identify trends. The general feature of multivariate designs is that all of the important variables are varied in each experimental run. The points in a run are generally arranged on the surface of a multidimensional sphere or cube. By using an approach were the user simply selects geometric points (e.g.. vertices, centers of edges, centers of faces, etc.) experiments can easily be generated with the desired number of points. Good results can be obtained without the mathematical analysis of trends simply by choosing the point that gave the best results and making this the center of the design for the next experimental run.
References [1] N.E. Chayen, P.D. Shaw Stewart, D. L. Maeder and D.M. Blow, J. Appl. Cryst. 23 (1990) 297. [2] N.E. Chayen, P.D. Shaw Stewart and P. Baldock, Acta Cryst. D50 (1994) 456. [3] J. Jankaric and S.H. Kim, J. Appl. Cryst. 23 (1991) 409. [4] P. Baldock, V. Mills and P. Shaw Stewart, J. Crystal Growth 168 (1996) 170. [5] C.W. Carter Jr., METHODS: A Companion to Methods in Enzymology, 1.1 (1990) 12. [6] G.E.P. Box and J.S. Hunter, Ann. Math. Statist. 28 (1957) 195. [7] G.E.P. Box and D.W. Behnken, Technometrics 2 (1960) 455. [8] C.W. Carter Jr. and Y. Yin, Acta Cryst. D50 (1994) 572. [9] L.F. Kuyper and C.W. Carter, J. Crystal Growth 168 (1996) 155. [10] B.D. Prater and L.J. Wilson, Abstr. Pap. Am. Chem. Soc. 215 (1998) 25. [11] P.C. Weber, Advances in Protein Chemistry, 41 (1991) 1. [12] D.M. Blow, N.E. Chayen, L.F. Lloyd and E. Saridakis, Protein Science 3 (1994) 1638.
Background Reading If you need more help, I suggest the following book - "Design and Optimization in Organic Synthesis" by Rolf Carlson, Patrick,
February 2001
|
|||||
|